Setting Up Gpu Telemetry
FPT Cloud utilizes NVIDIA GPU Telemetry with kube-prometheus-stack as a monitoring toolkit for Kubernetes cluster with GPU. The toolkit consists of collectors, a Time-series Database to store metrics, and a visualizer to visualize data. The toolkit uses widely-known open-sourced tools such as Prometheus and Grafana. Prometheus also includes Alertmanager to create and manage alerts. Prometheus is deployed alongside kube-state-metrics and node_exporter to collect cluster-level metrics such as Kubernetes API resources and node-level metrics such as GPU utilization.
- To view GPU’s custom metrics, run this command:
Copykubectl get –raw /apis/custom.metrics.k8s.io/v1beta1 | jq –r . | grep DCGM
- Access Prometheus to view GPU DCGM’s metrics:
To forward Prometheus’ service, run this command:
Copykubectl port-forward service/kube-prometheus-stack-1679-prometheus 9090:63090
Where 9090 is Prometheus’ service port, 63090 is local port on your client. Prometheus is now accessible locally athttp://localhost:63090/
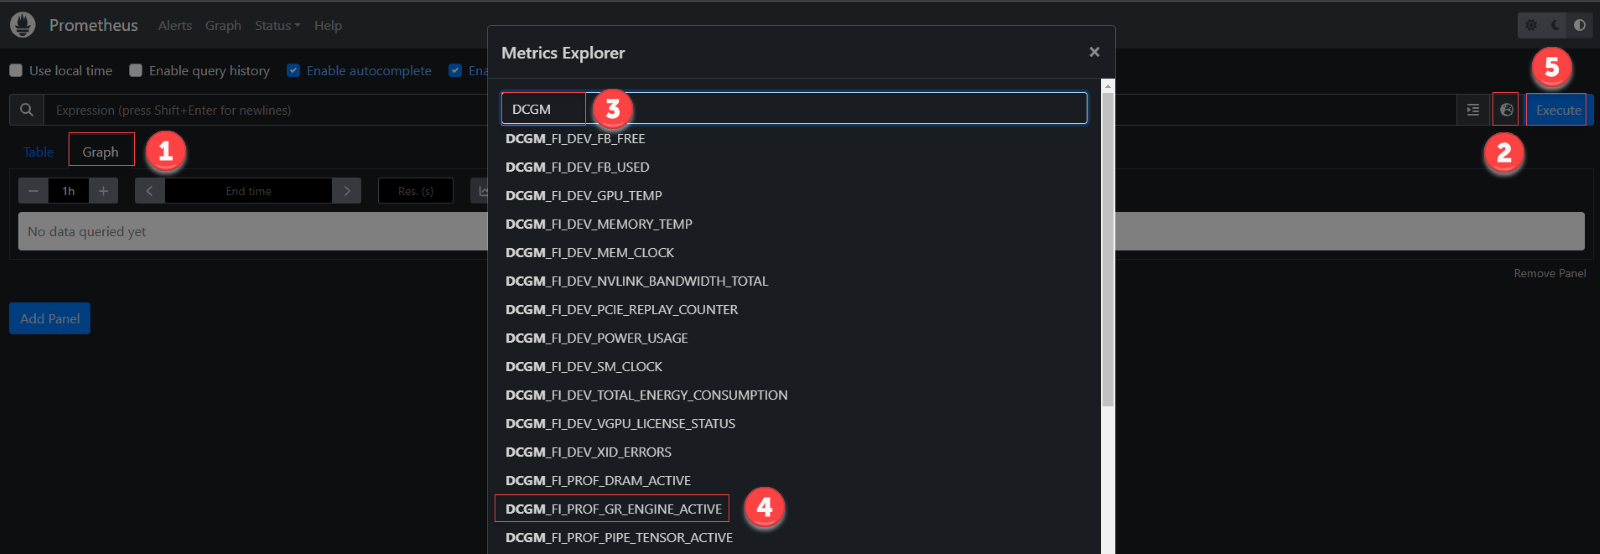
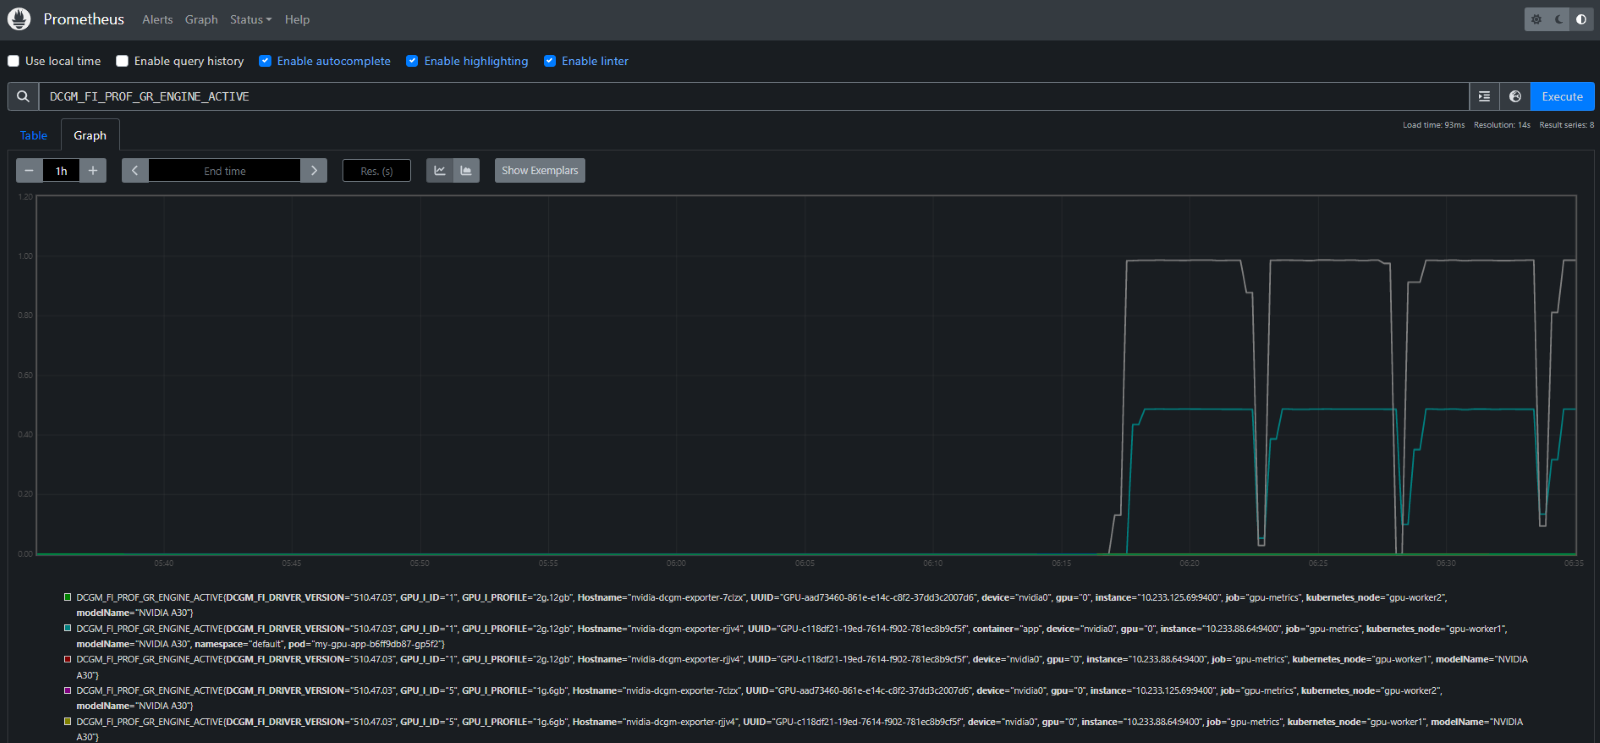
On the Prometheus interface, navigate to Metrics Explorer to view GPU DCGM’s metrics:
- Access Grafana Dashboard
To forward Grafana’s service, run this command:
Copykubectl port-forward service/kube-prometheus-stack-1679050354-grafana 80:63080
Where 80 is Grafana’s service port, 63080 is local port on your client. Grafana is now accessible locally athttp://localhost:63080/ The default username and password for logging into Grafana are:
CopyUser: admin
Password: prom-operator
- Import Grafana Dashboard for GPU metrics:
To import the Dashboard, navigate to Grafana > Dashboards > Manage > Import.
To use FPT Cloud’s GPU Dashboard, copy this FPT Cloud GPU Dashboard json dashboard as text or import JSON file > Load.
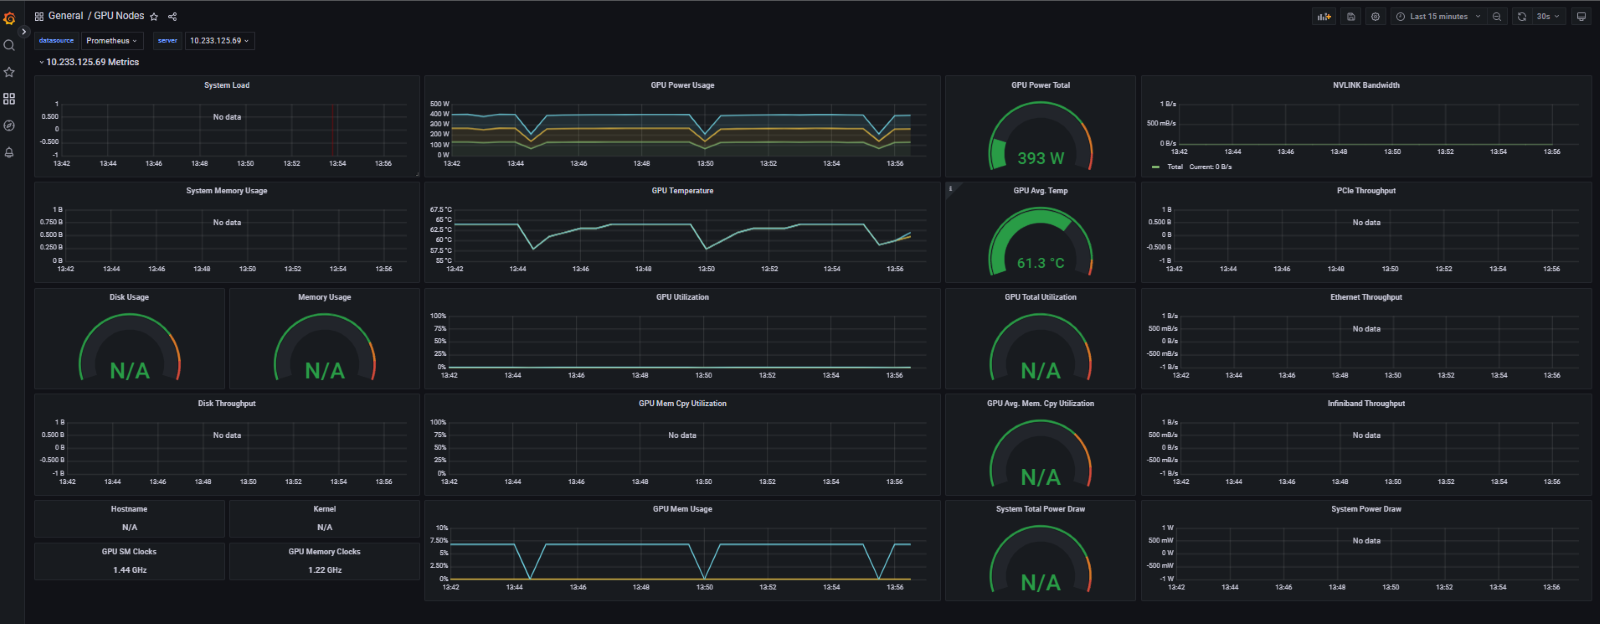
FPT Cloud’s GPU Dashboard: