Incident Data Visualization
Incident Insights enables the ability to visualize incident data, facilitating the exploration of metrics and trends in incident response performance
View Incident Insights
Step 1 : Log in to FMON Grafana.
Step 2 : From the sidebar menu, choose Apps > FMON - Incident > Insights
The incident data visualization chart displays the following key metrics:
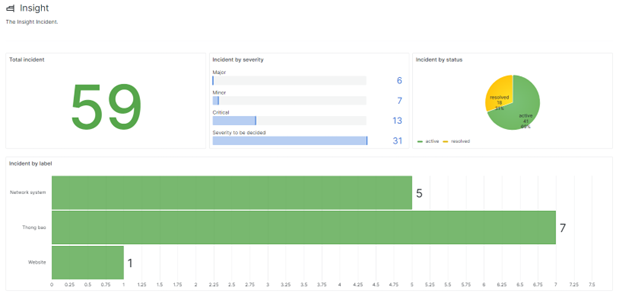
- Total Incident : Total number of incidents
- Incident by severity : Number of incidents by importance level
- Incident by status : Number of incidents by incident status
- Incident by label : Number of incidents by labels attached to incidents